返回到:Ext.js:图表(chart)
此图表用于表示饼图格式的数据。它是一个极坐标图。
语法
这里是简单的语法。
 Ext.create('Ext.chart.PolarChart', {
 series: [{
   Type: 'pie'
   ..
   }]
   render and other properties.
 });
例
下面是一个简单的例子显示用法。
<!DOCTYPE html>
<html>
<head>
<link href="./ext-6.0.0/build/classic/theme-classic/resources/theme-classic-all.css" rel="stylesheet" />
<script src="./ext-6.0.0/build/ext-all.js"></script>
<script src="./ext-6.0.0/build/packages/charts/classic/charts.js"></script>
<script type="text/javascript">
Ext.onReady(function() {
Ext.create('Ext.chart.PolarChart', {
renderTo: document.body,
width: 600,
height: 300,
store: {
fields: ['name', 'g1'],
data: [
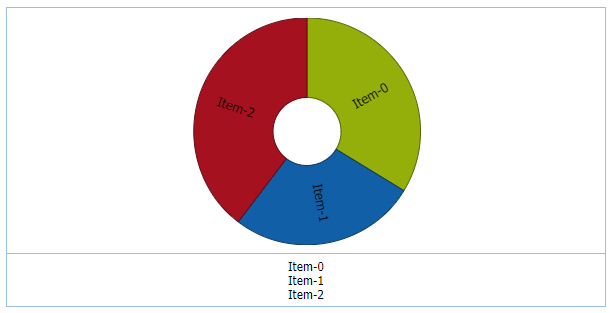
{"name": "Item-0", "g1": 57},
{"name": "Item-1", "g1": 45},
{"name": "Item-2", "g1": 67}
]
},
//configure the legend.
legend: {
docked: 'bottom'
},
//describe the actual pie series.
series: [{
type: 'pie',
xField: 'g1',
label: {
field: 'name'
},
donut: 30 // increase or decrease for increasing or decreasing donut area in middle.
}]
});
});
</script>
</head>
<body>
</body>
</html>运行效果截图为:

返回到:Ext.js:图表(chart)
作者:terry,如若转载,请注明出处:https://www.web176.com/extjs_api/11699.html
 支付宝
支付宝  微信
微信